Instructions for using Movemaps 2002
Movemaps 2002 allows you to create map overlays for the state of Georgia and to create forestry-data graphs indicating wood availability by properties such as volume, value, diameter class and stand type.
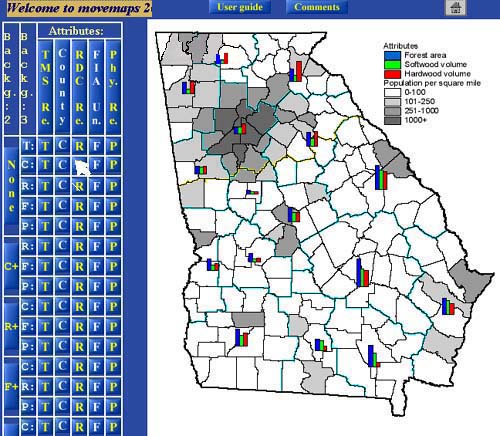
Tutorial-Figure 1: In the Movemaps table as in the lower
left, move your cursor over one of the "Attributes" layers, T, C, R, F, or P
. For each letter a different map overlay
containing the pointed-to Attribute and background layers will
appear on the right. Click the attribute letter when you see an overlay you want
to display.

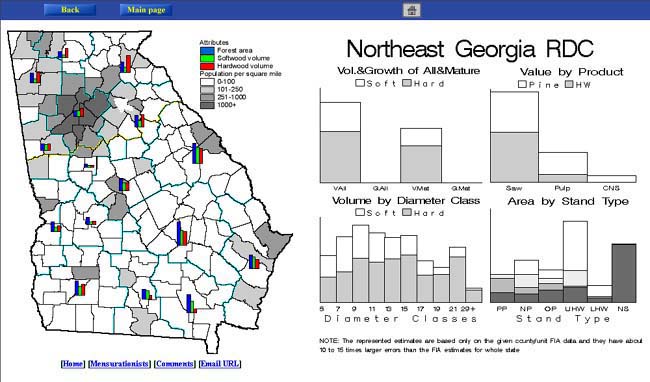
Tutorial-Figure 2: The map overlay will show as below left. Choose which regional information
(shown in the thumbnail on the right) will be displayed on the
right side of the graphic: Move the cursor to the region on the map overlay for which
you wish to see data, and click.


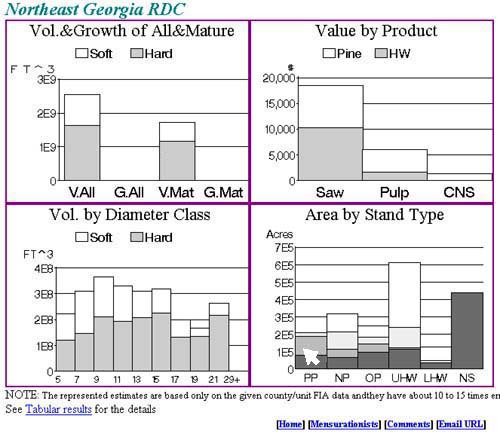
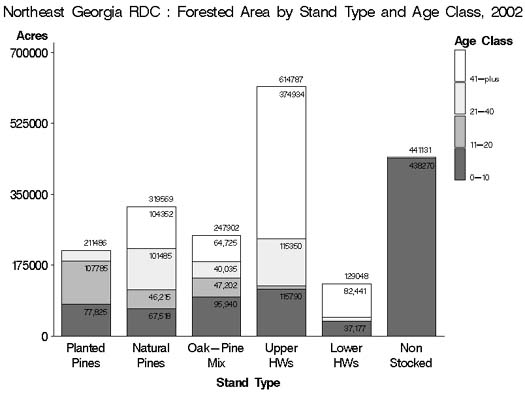
Tutorial-Figure 4: Clicking the "Area by Stand Type" graph from the above set displays the full-size version of the graph.
